Tool 21 of 32 · about an hour
Decision Decay Curve
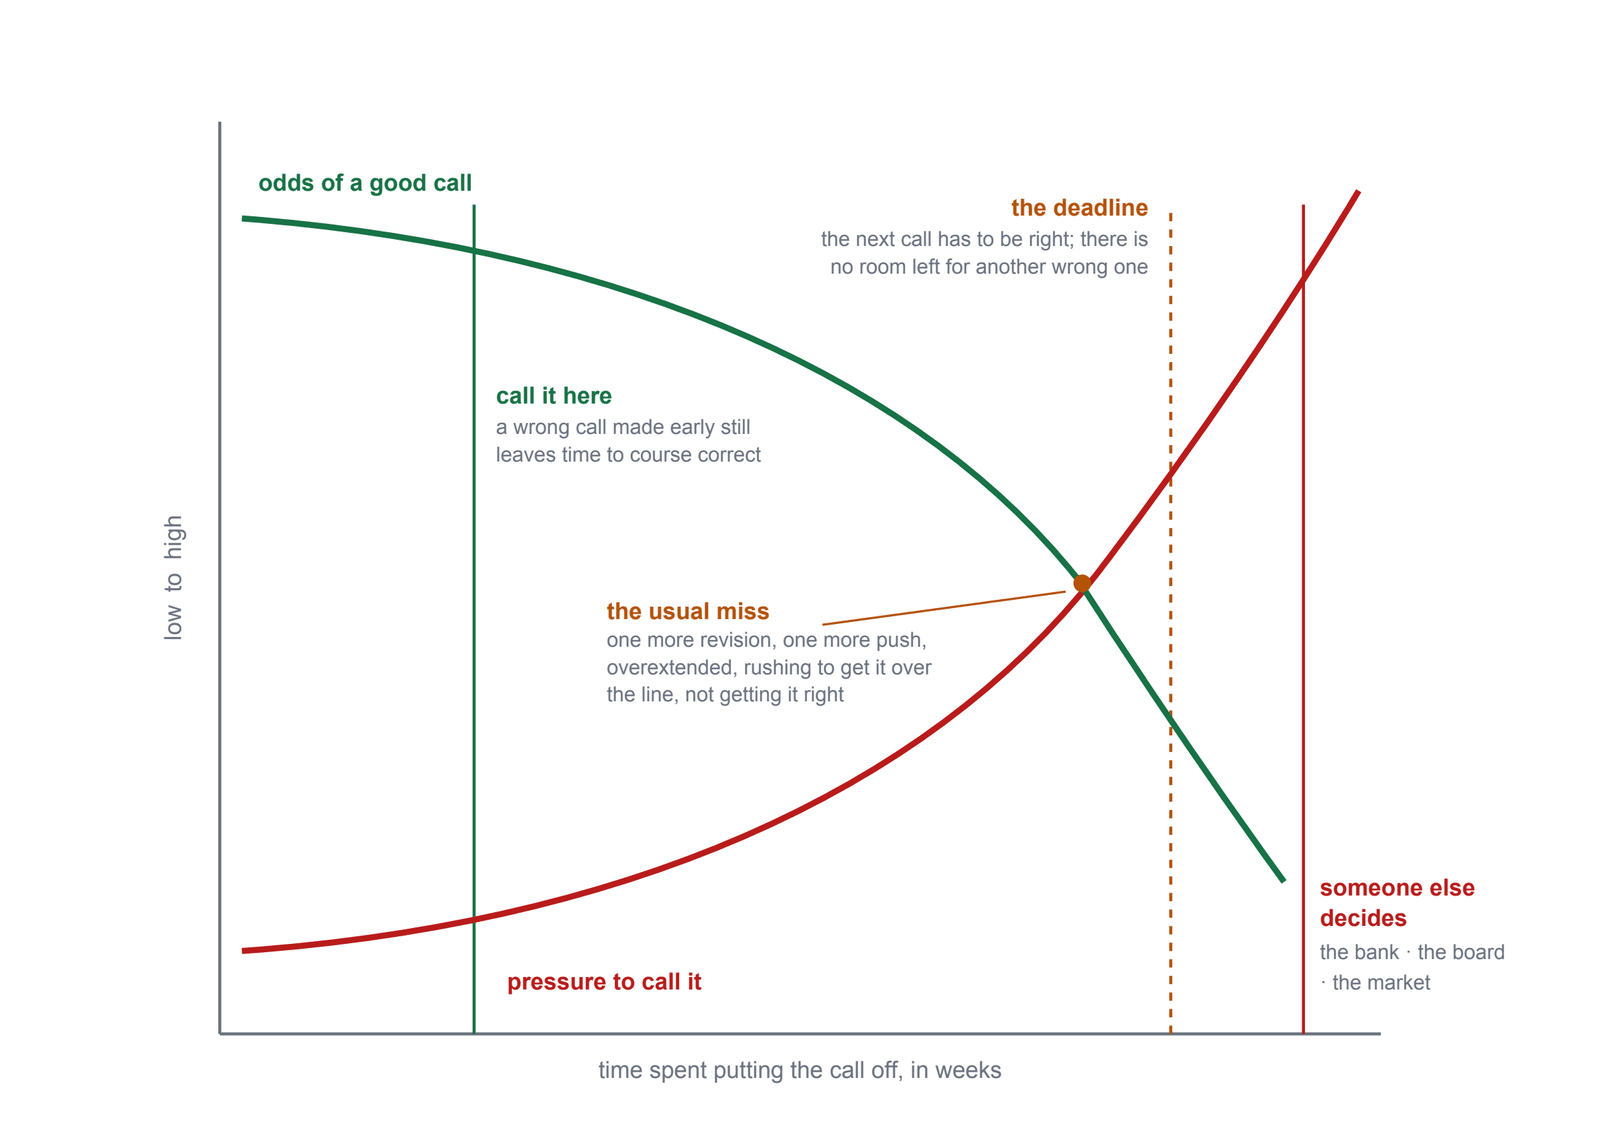
A one-page picture of what waiting costs. Deferred calls do not get easier; eventually someone else makes them on worse terms.
On decision day, drawn once, immediately before presenting the Decision Contract, with real facts spoken beside it from the captured baselines.
What it is for
To show what waiting actually costs, as a picture of the idea, so delay stops feeling free and the contract has a moment to catch.
The failure it catches
Deferred hard calls do not get easier. Pressure rises while the odds of making the call well fall, until eventually someone else, a bank, a board, the market, makes the call on the worst available terms.
Why it works
A picture of pressure rising and the odds of a good call falling, named as a picture before the pen moves, with this company's real runway, recurrence and warning times spoken beside it, makes waiting stop feeling like a free option. The curve exists to create the moment. The contract exists to catch it.
How to run it
- One page, drawn as a picture of the idea, and say it is a picture before the pen moves.
- Along the bottom, weeks of deferral. One line rising: the pressure, runway burning, options narrowing. One line falling: the odds of a good decision made freely. The marks beside the curves are illustrations. Nothing on the page plots the company.
- What makes the picture yours is spoken beside it, out loud, from real facts already captured: the actual runway, how often the problem has come back, the findings from earlier steps. Invented facts are manipulation, and people can tell.
- Ask two questions, then stop talking. What does next week cost, in this picture. And where on this curve does someone else start deciding for us.
- Draw it once, at the moment of decision. Then present the Decision Contract while the moment is still open.
How to read the result
Nothing on the page is a measurement, and we say so before drawing it. The objective content is the facts spoken beside the picture, each re-runnable from the captured baselines. The picture itself only explains why waiting does not buy a better decision. The silence after the second question is the tool working. Do not fill it.
How to run it well
- Saying it is a mindset picture up front is part of what makes it land.
- Place it immediately before the contract. Separate them and both go to waste.
Where it breaks
- This is a mindset picture, never a measurement. Dressed up as arithmetic it hands every skeptic a free win.
- The facts spoken beside it must be real and checkable. Invented ones are manipulation, and people can tell.
- Draw it once, at the moment of decision. Redrawing it weekly as a pressure device burns it.
What would prove it wrong
Holders who sign without the curve, or who see the curve twice and never sign, both count against the claimed mechanism.
What we watch
Whether the picture-then-contract sequence is what produces signatures, or whether people sign just as often without the picture.
Ask yourself
- What does one more week of not making this call cost, in runway, options, and morale you can actually point to?
- Where on this picture does someone else start deciding for you: a bank, a board, the market?
- Are the facts you would speak beside the picture written on the baseline sheet, or are they a feeling?
- If you drew this every week as a pressure device, would anyone still believe it?
Fed by: Baseline Vitals, Decision-Conditions Test, Runway Trace
Feeds: Decision Contract